Incident Media Maps
Could not determine your location.
 Wildfire
 Prescribed Fire
 Burned Area
Response
Burned Area
Response Other
Other
Maps Gallery
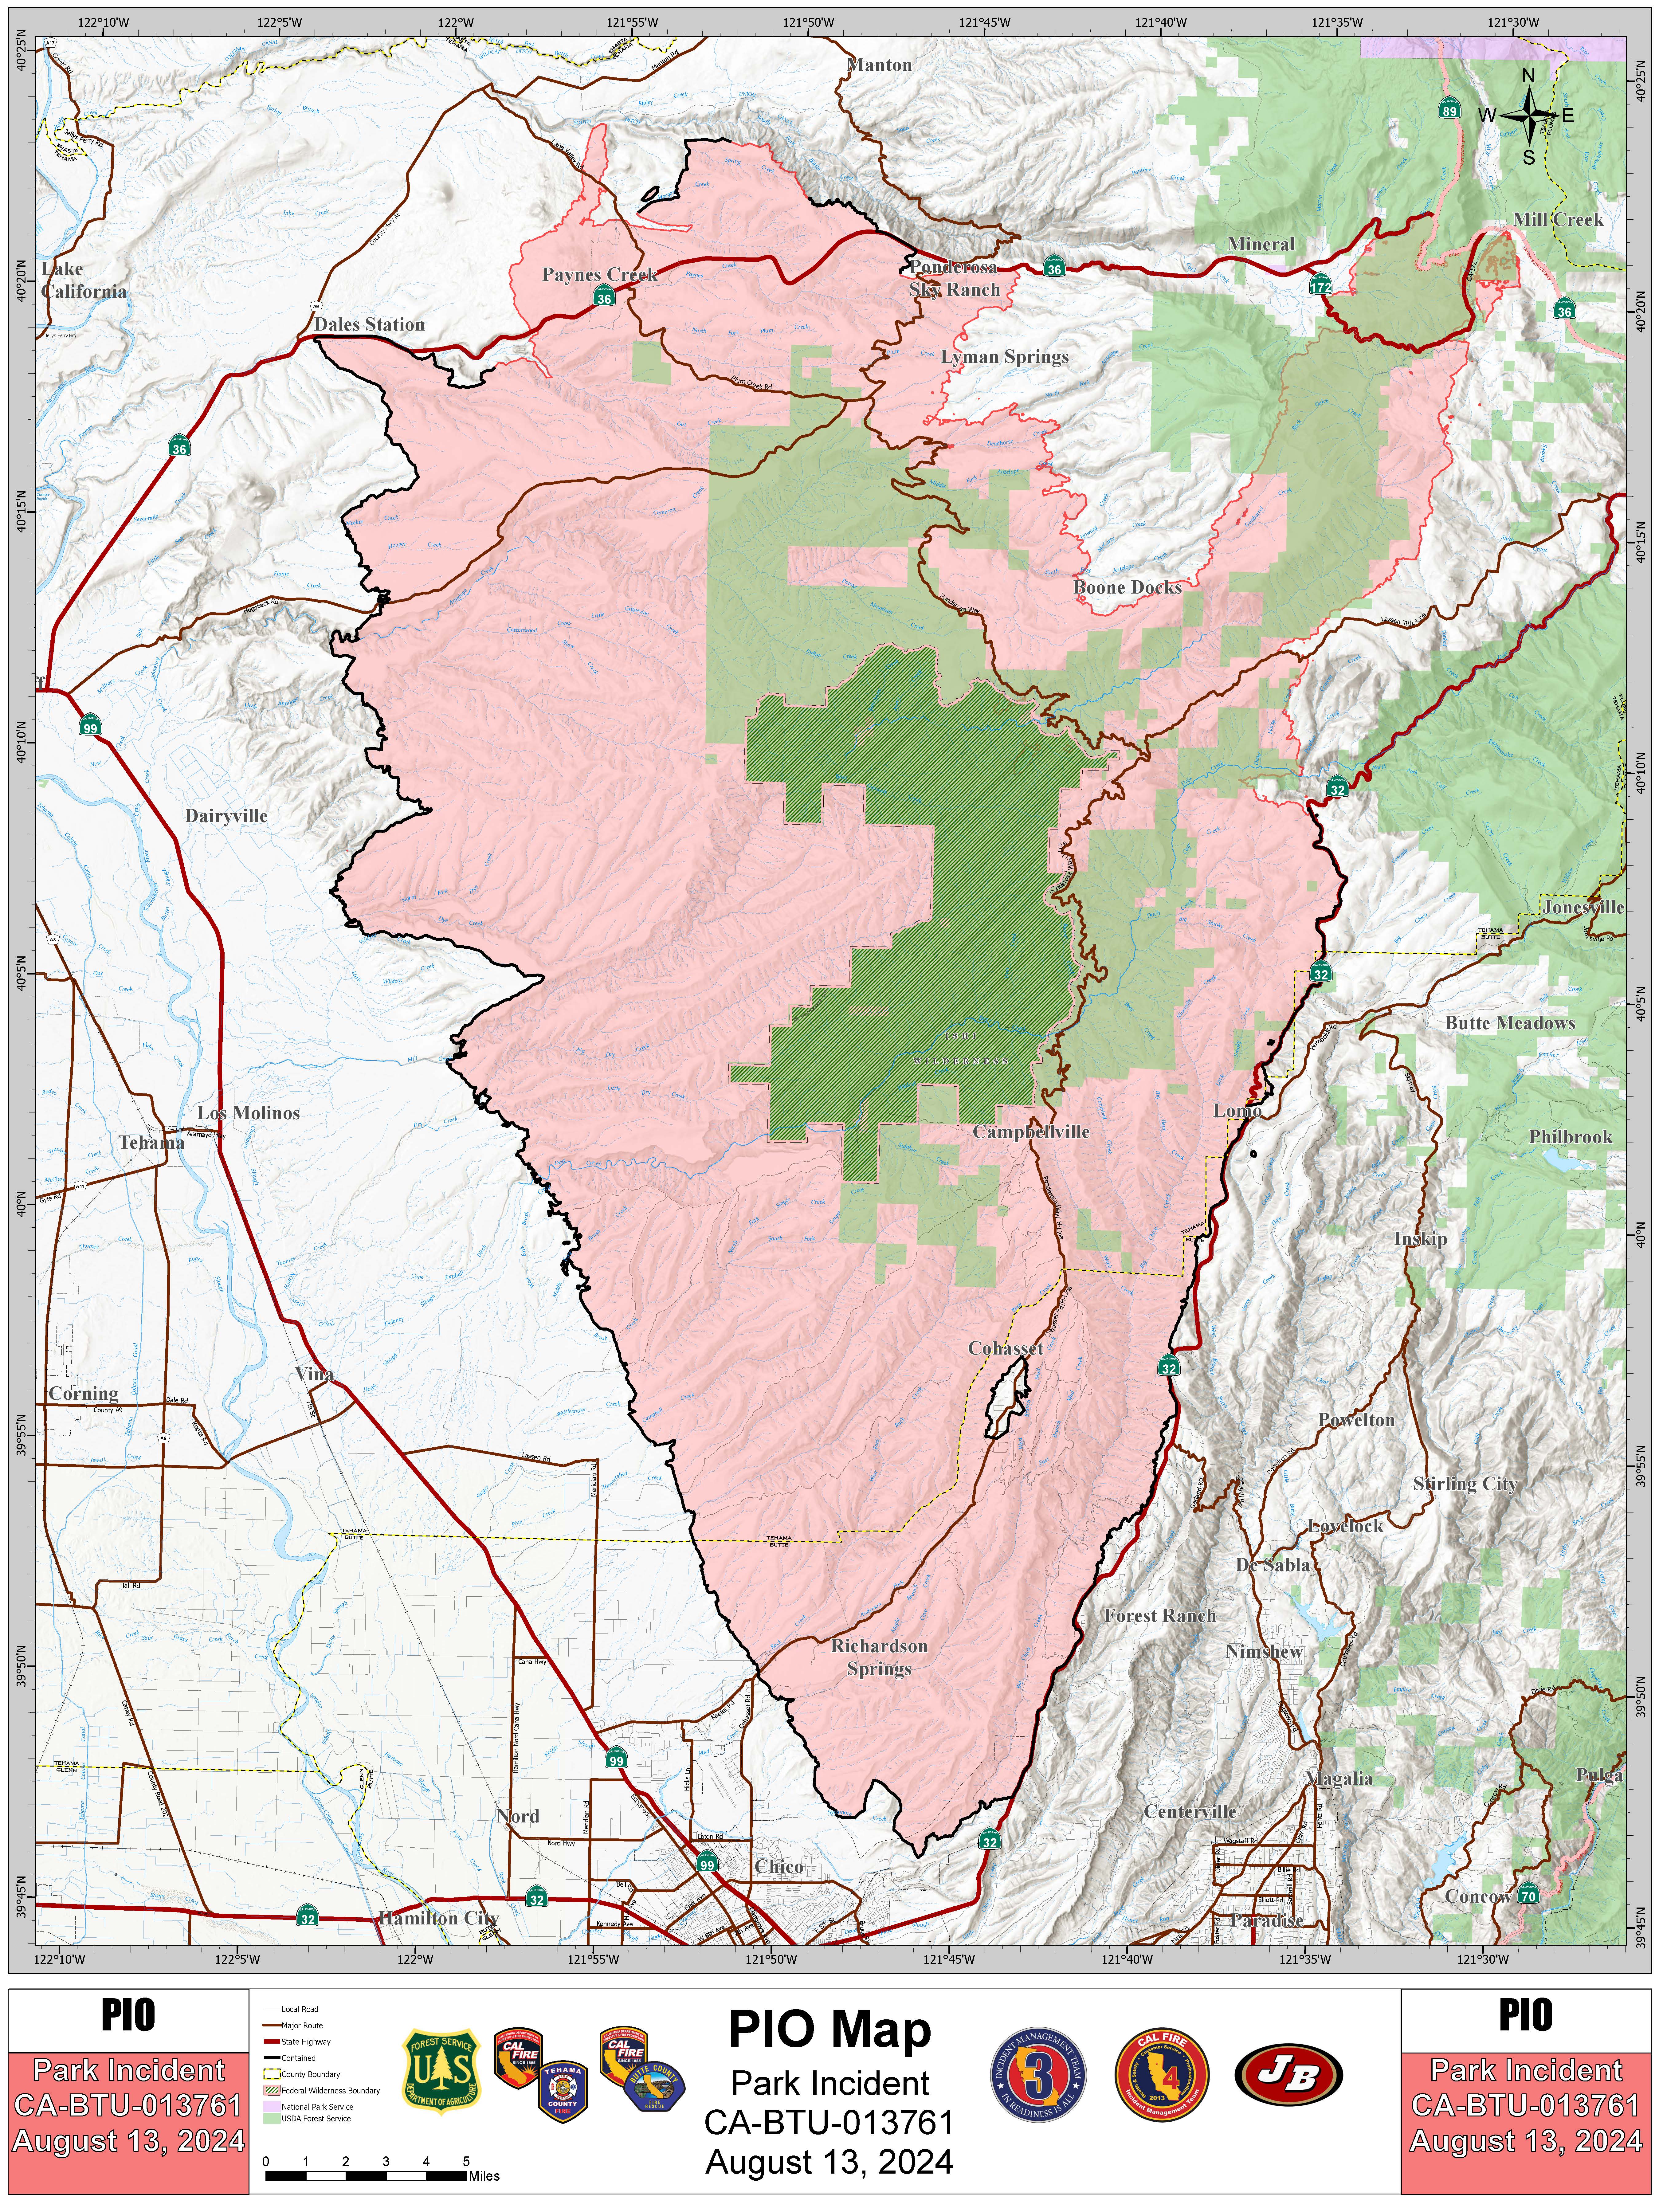
This map shows the fire perimeter over time, displaying a spectrum of colors. It uses cold colors (blue and purple) to show the fire perimeter during the earliest days of the incident, and hot colors (red and orange) to display the fire on more recent days. County lines are represented with a dashed yellow and black line. Some roads and highways are also displayed.
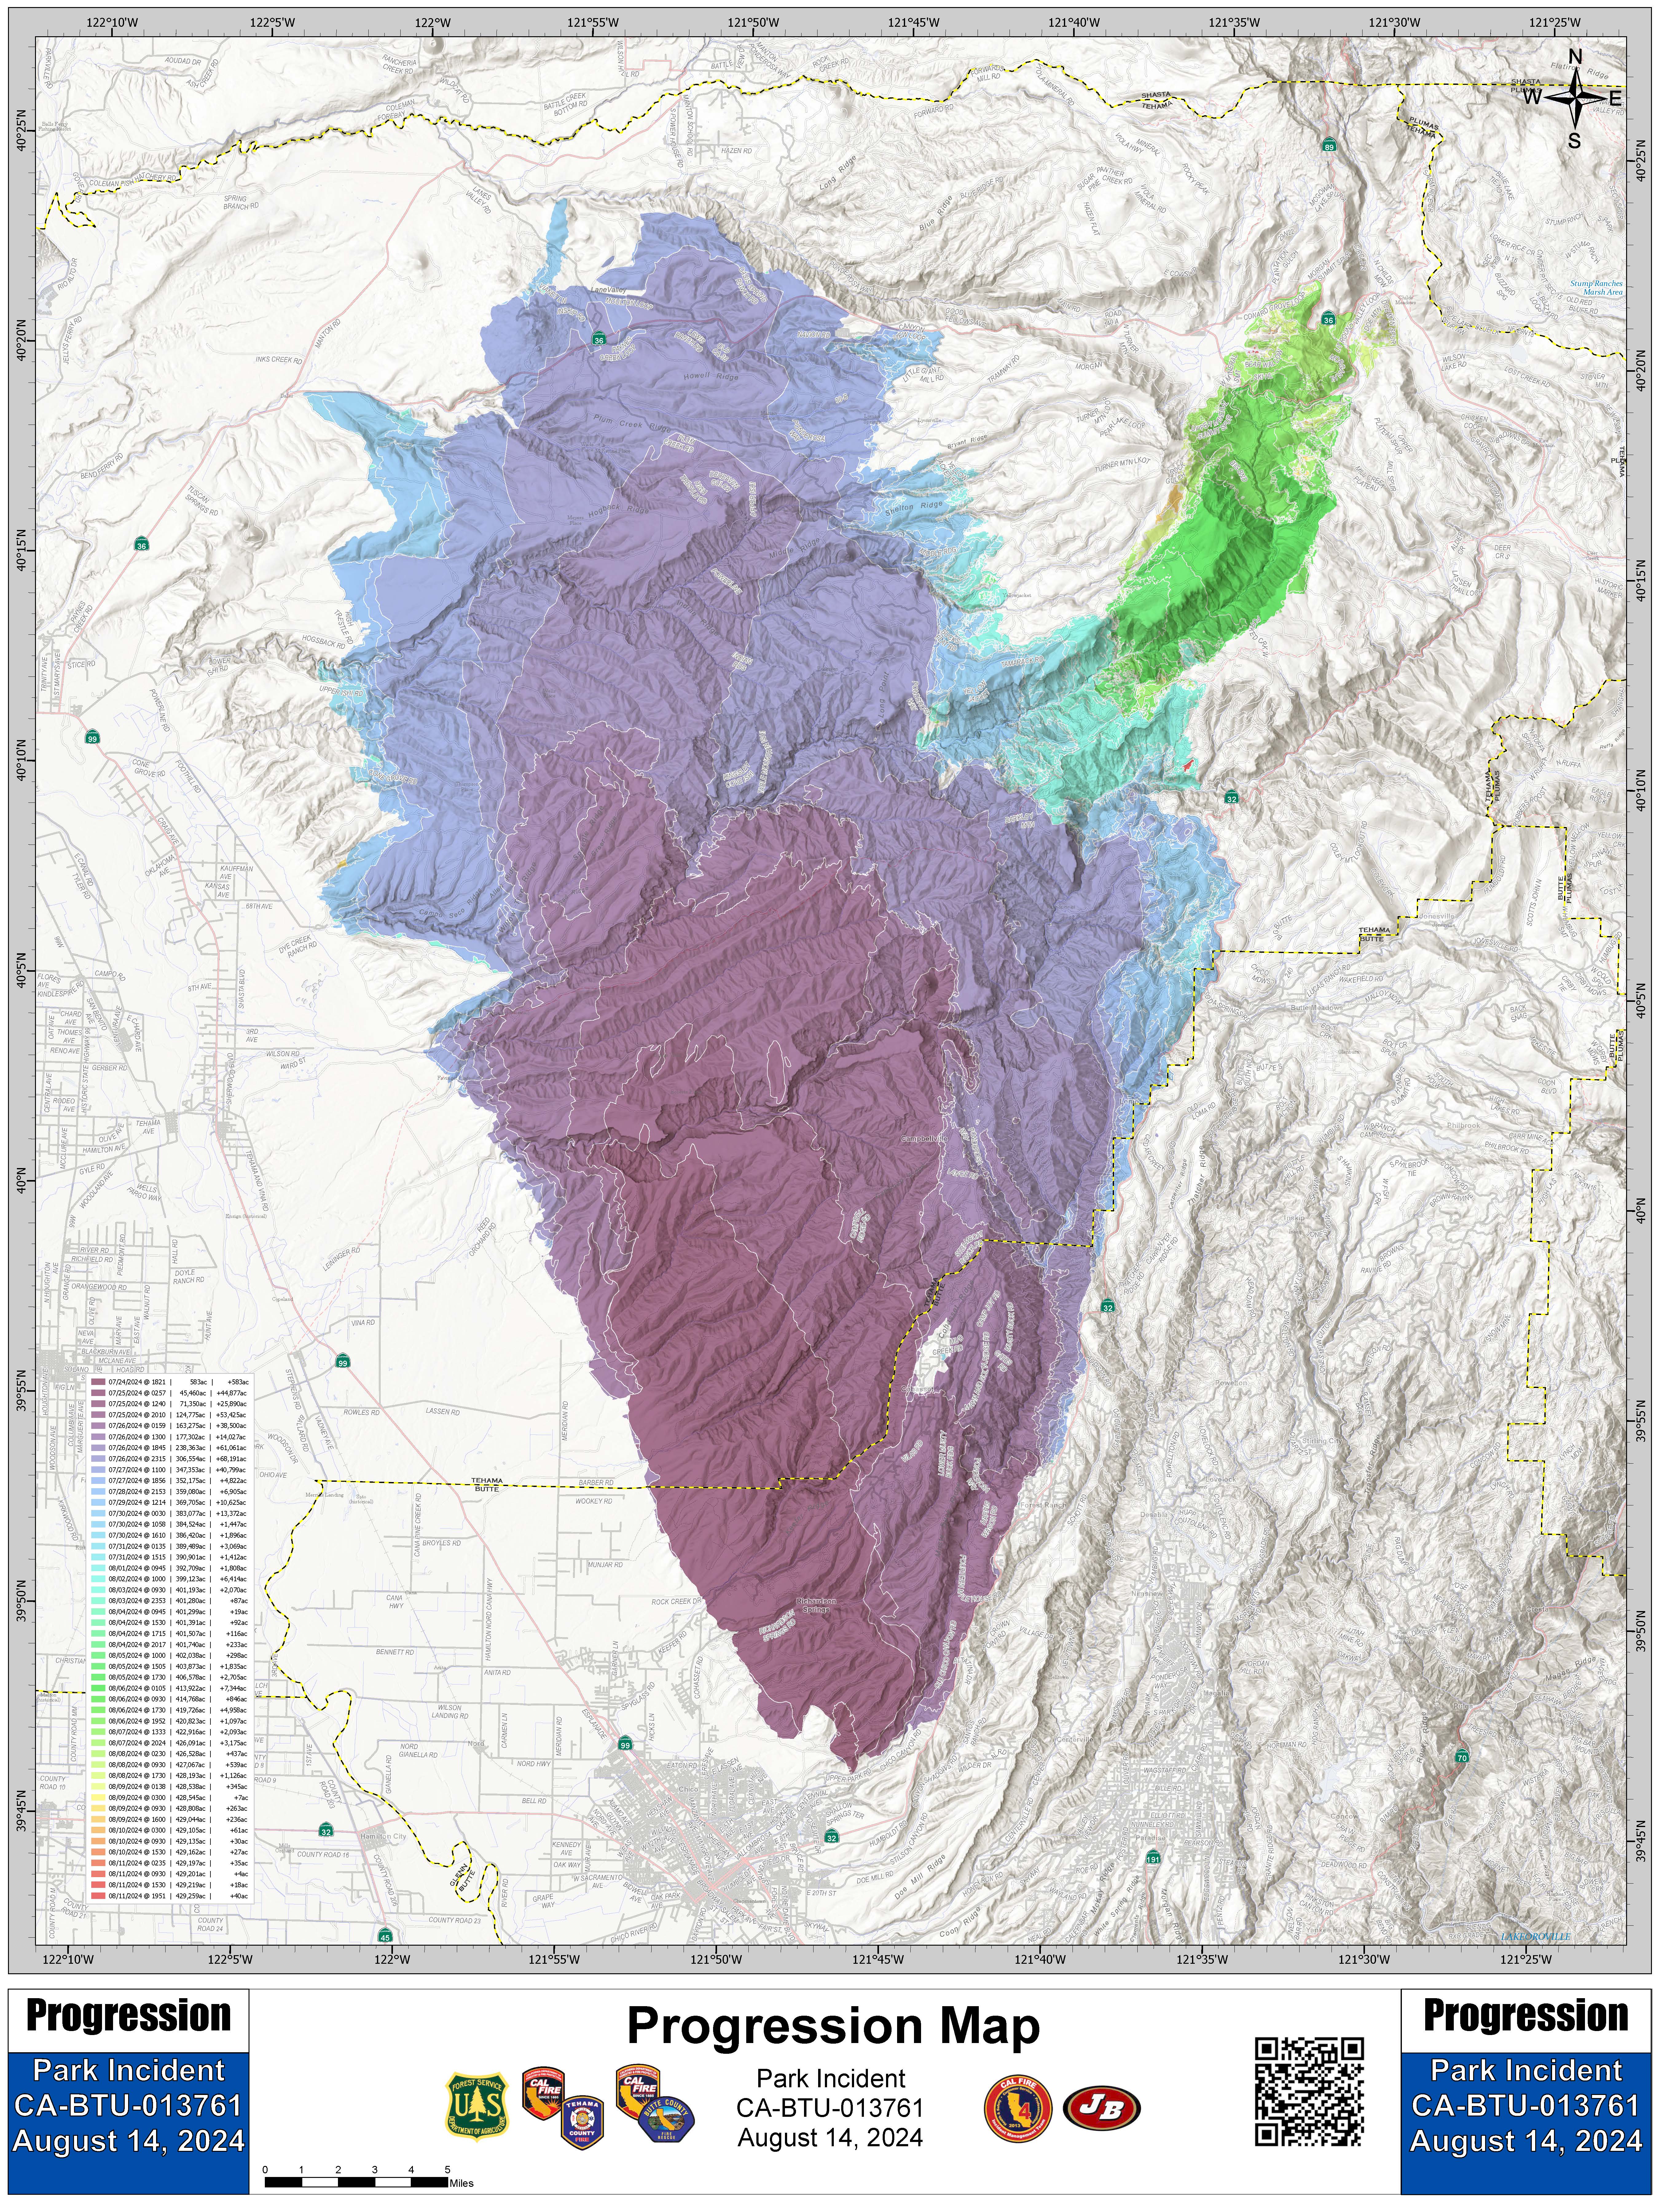
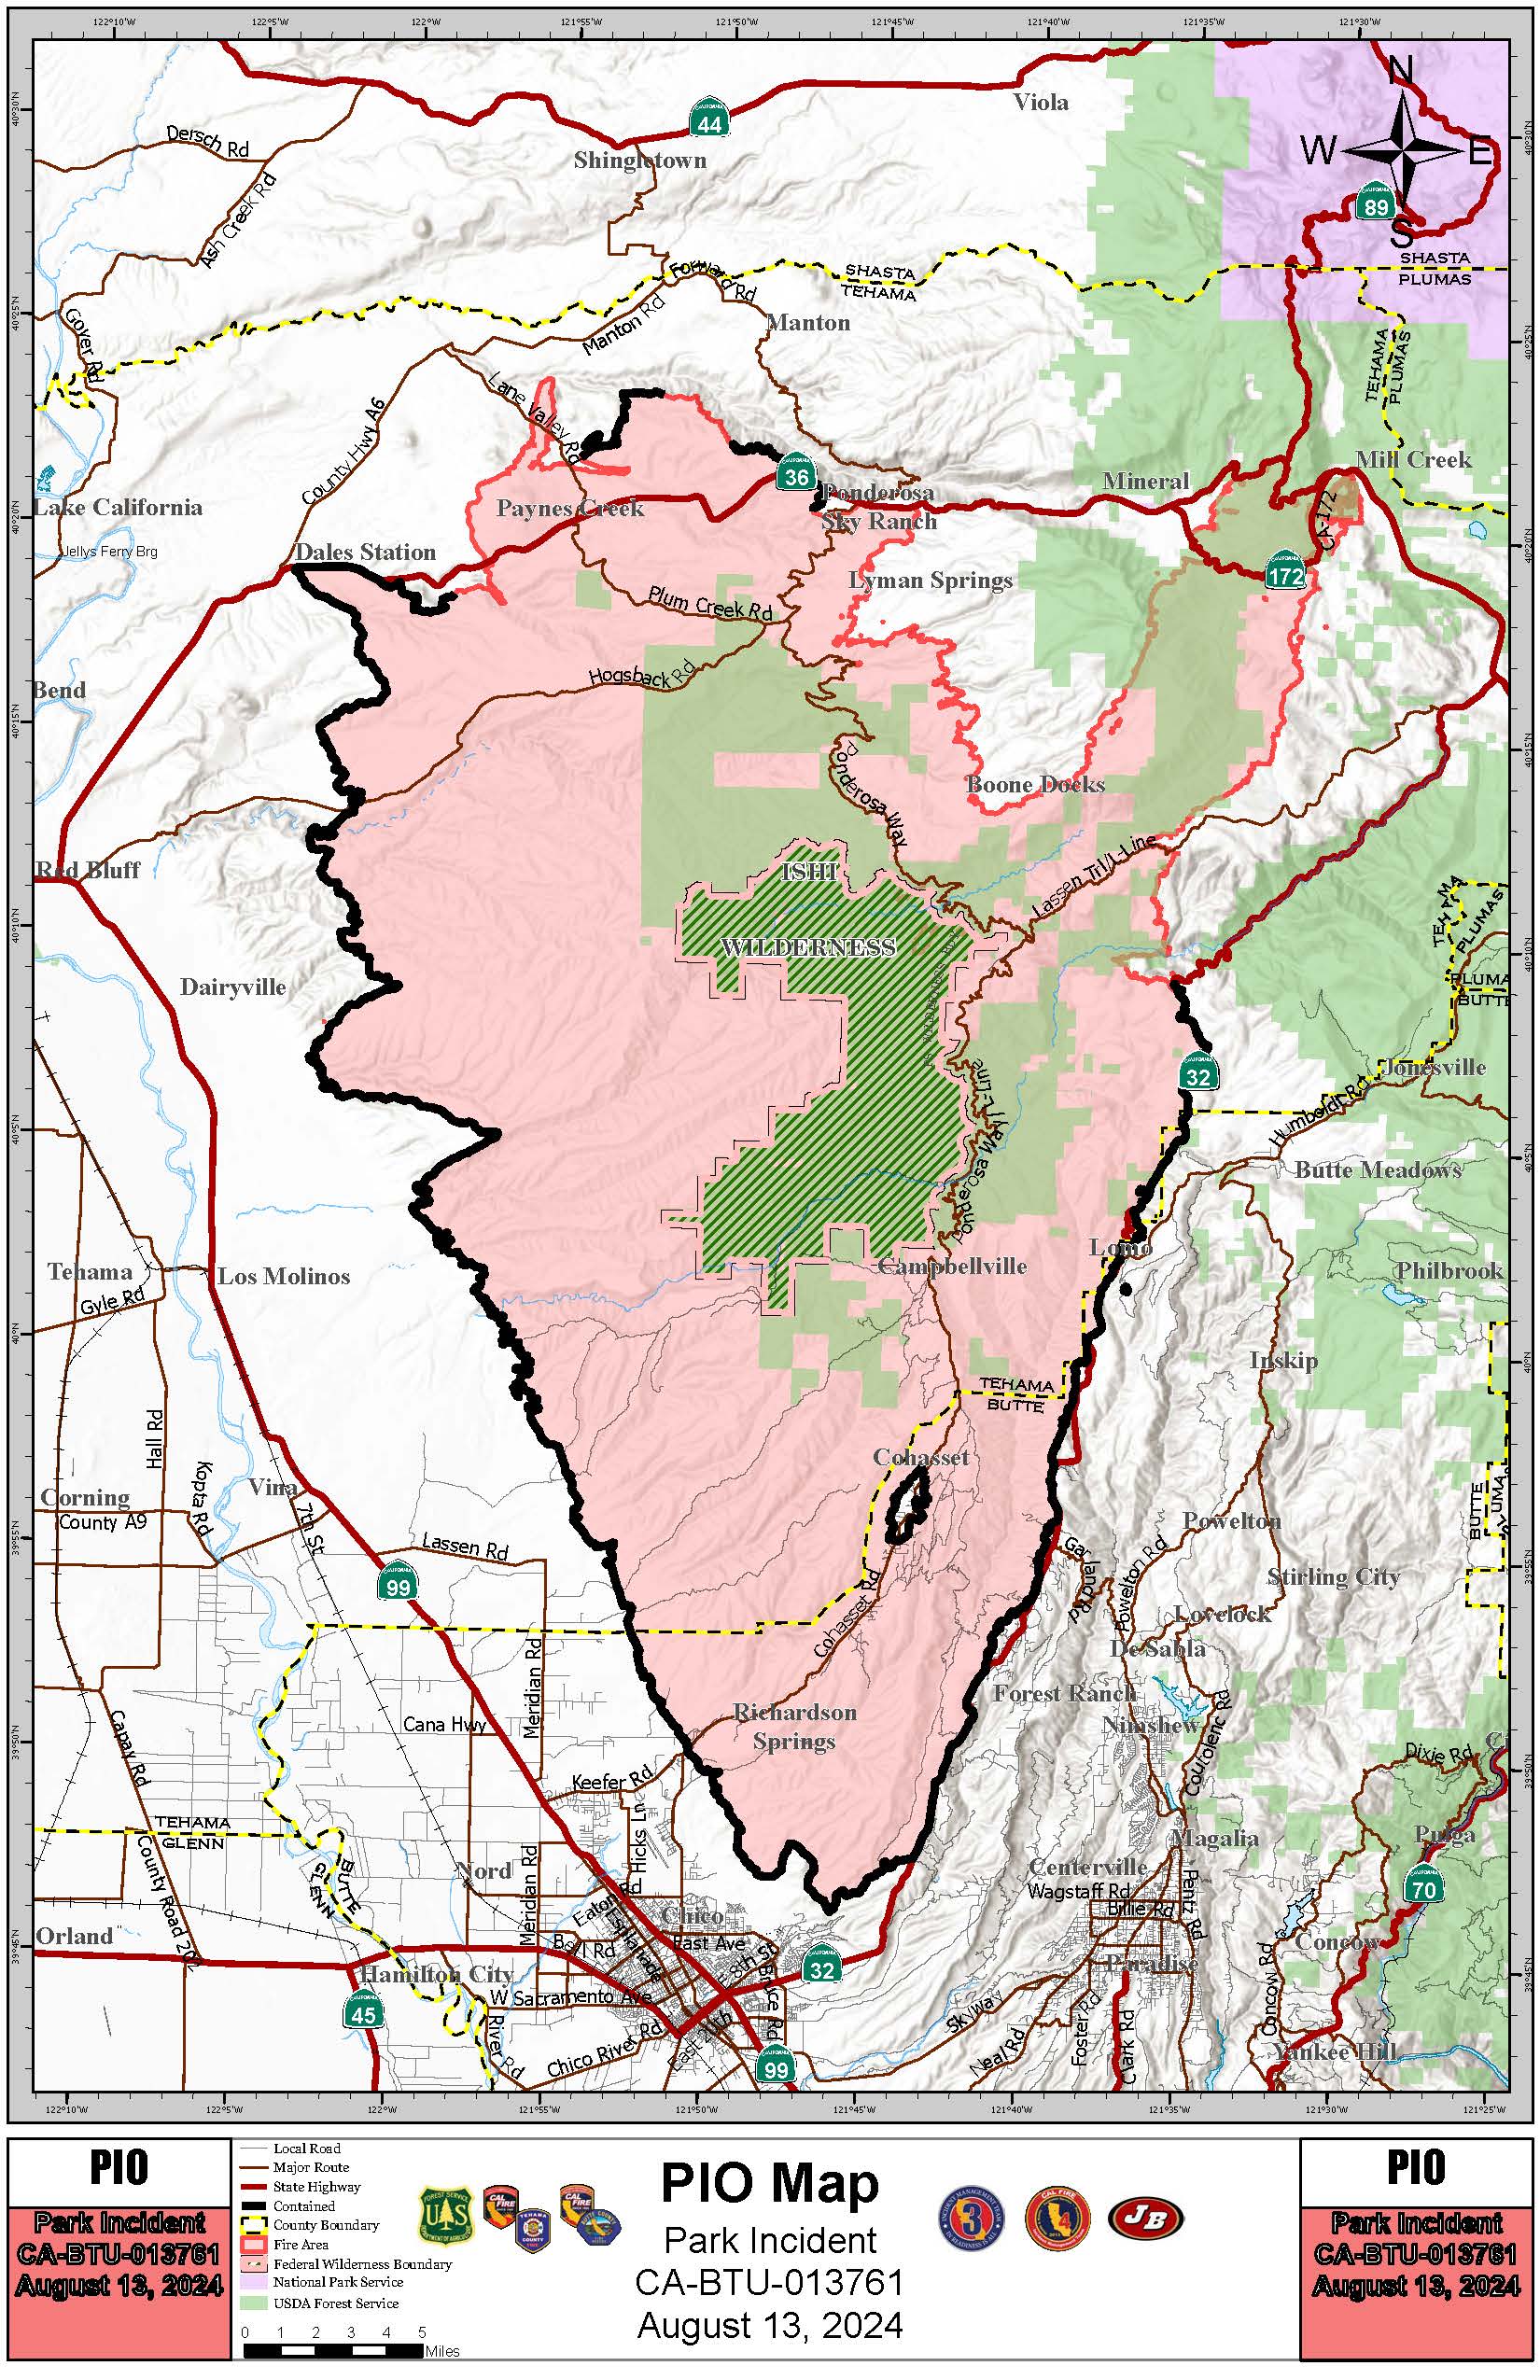
This map shows the fire perimeter over time, displaying a spectrum of colors. It uses cold colors (blue and purple) to show the fire perimeter during the earliest days of the incident, and hot colors (red and orange) to display the fire on more recent days. County lines are represented with a dashed yellow and black line. Some roads and highways are also displayed.


This map shows the fire perimeter over time, displaying a spectrum of colors. It uses cold colors (blue and purple) to show the fire perimeter during the earliest days of the incident, and hot colors (red and orange) to display the fire on more recent days. County lines are represented with a dashed yellow and black line. Some roads and highways are also displayed.